
Trimble’s subscription transition is the strategy.The data architecture to manage it is the missing infrastructure.
We build the unified analytics substrate — Data Cloud, Tableau Next, and a shared COE operating model — that makes your 40% to 65% recurring revenue transition visible, trackable, and trustworthy across Construction, Agriculture, and Transportation.
 ×
×
About Teqfocus
The partner that owns the data layer and the application layer — and operates what it deploys
Most data platform engagements deliver a pipeline. Teqfocus delivers agents that run on it — and keeps them performing through AgentOps managed services.
Market Positioning
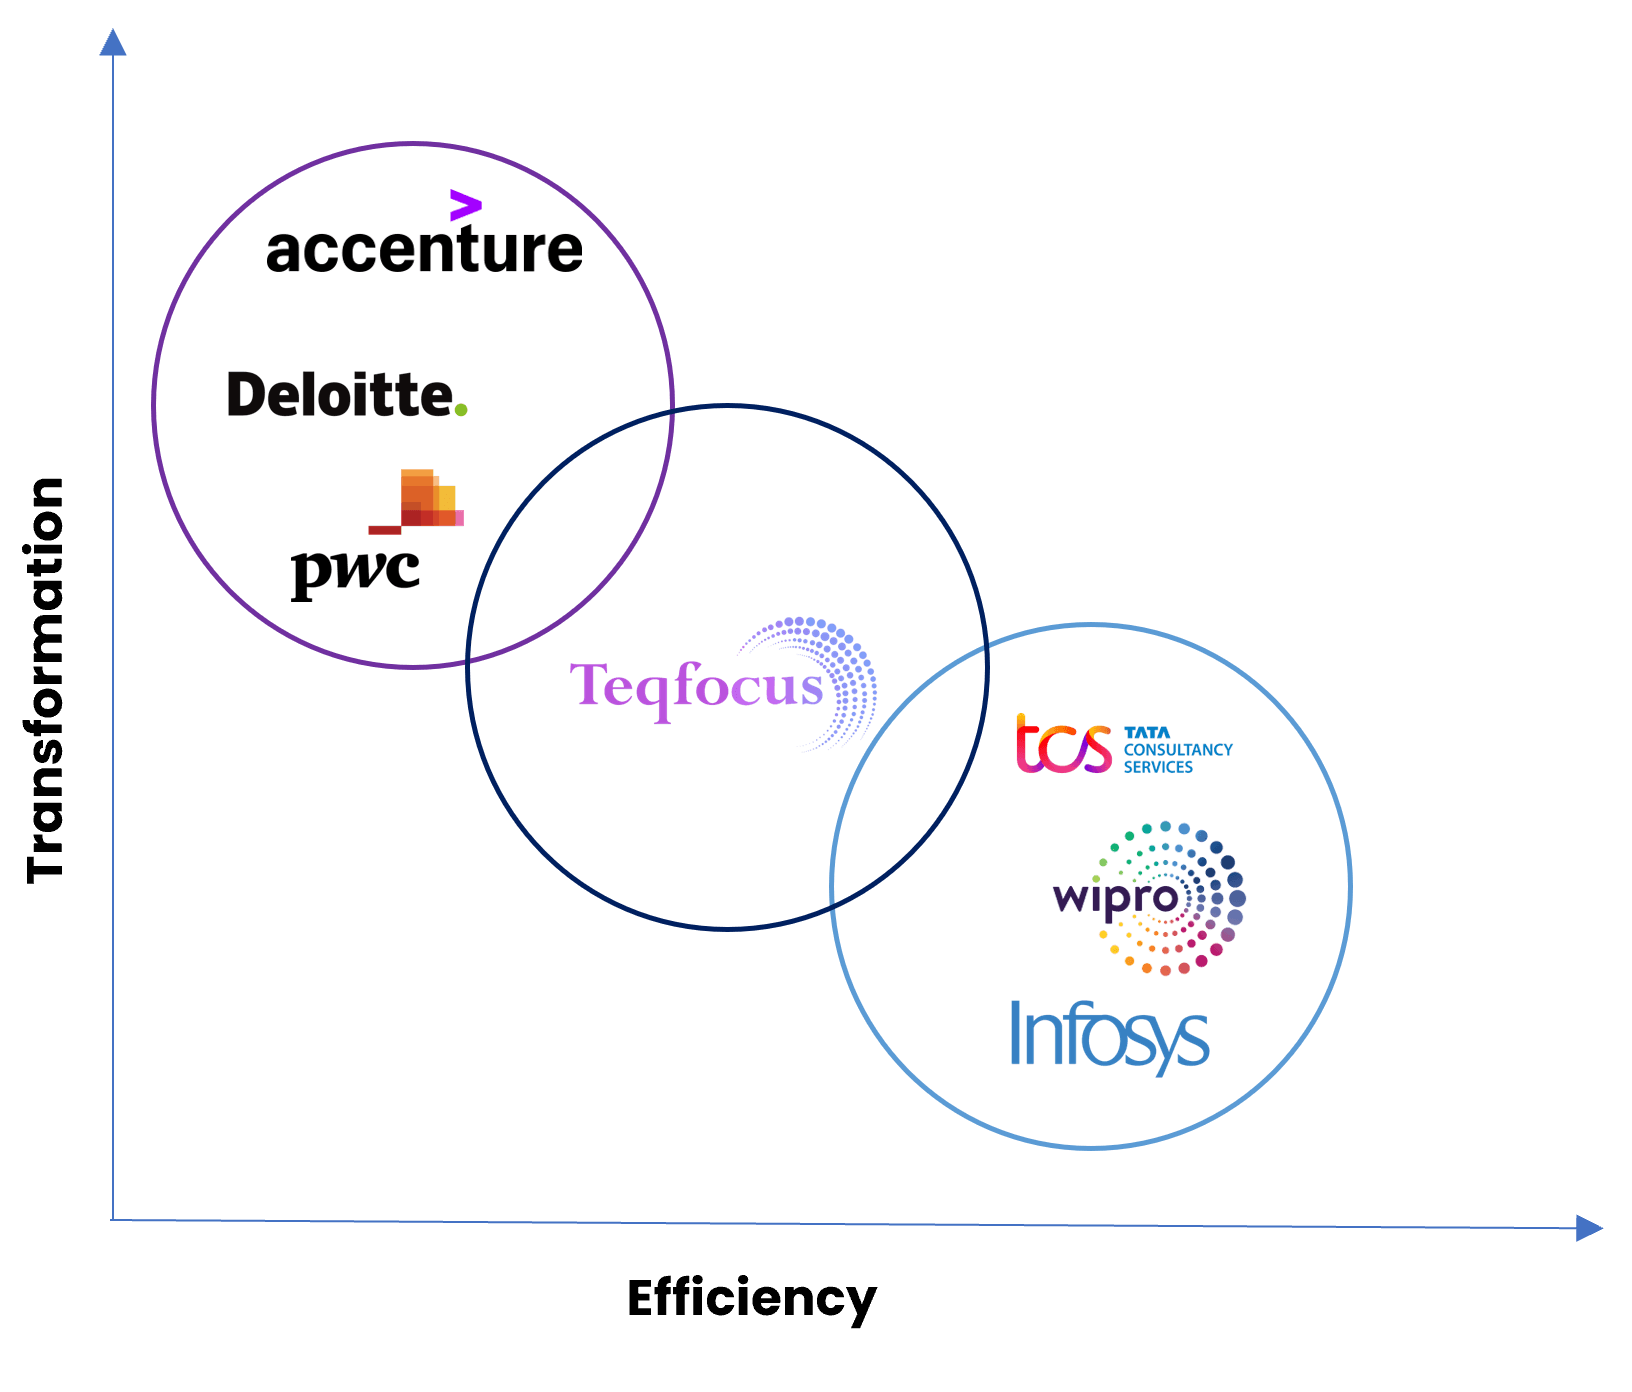
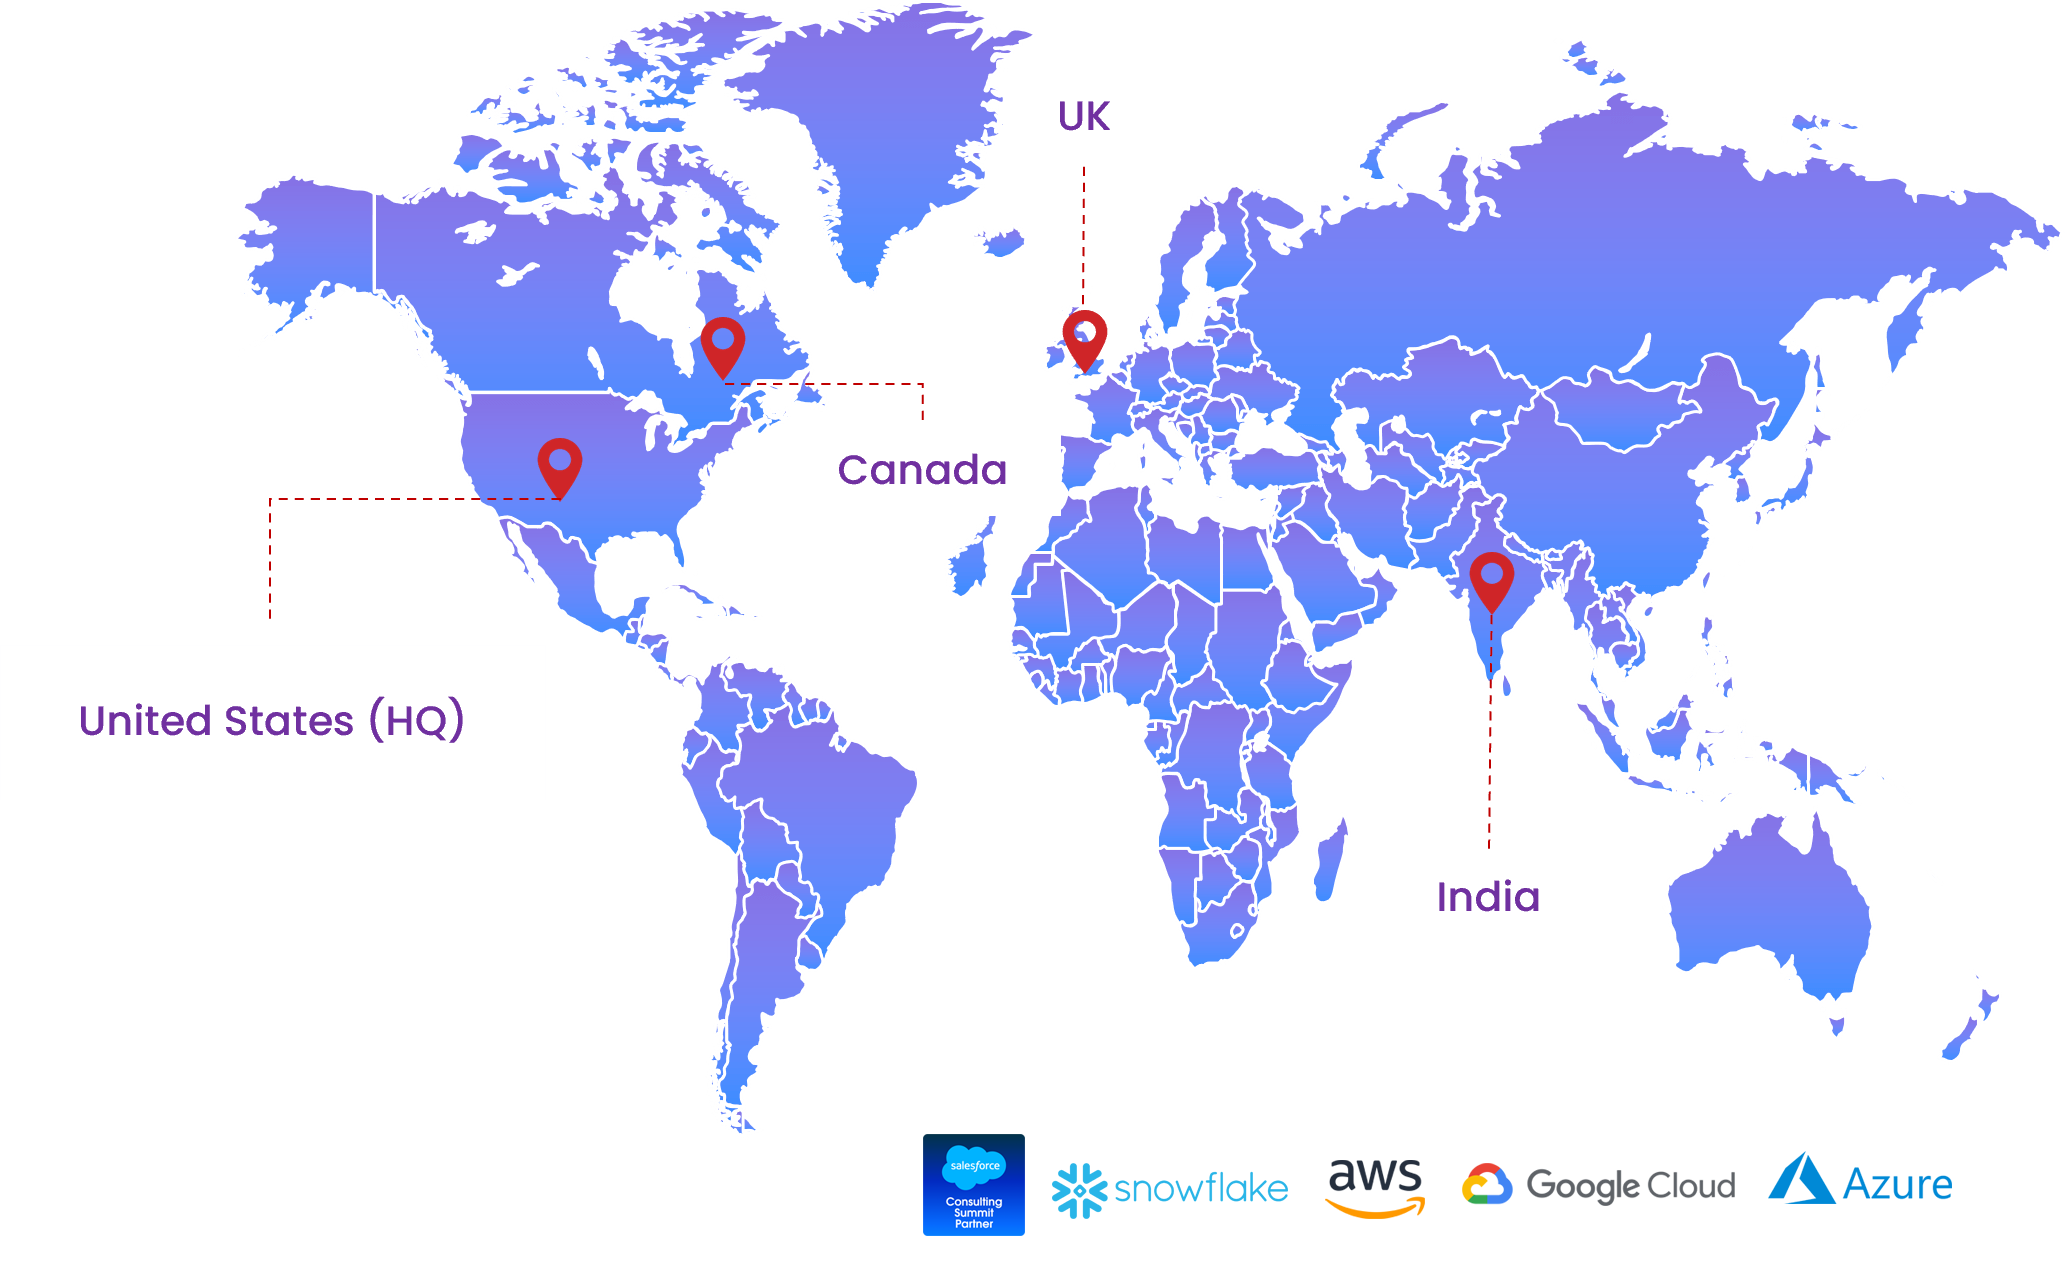
Global Presence
Why we're reaching out now
Why we're reaching out to Trimble now
Trimble's shift to a recurring revenue model is a strategic commitment — not a reporting exercise. But the data infrastructure to manage that transition doesn't yet match the ambition. Each acquisition brought its own CRM configuration, its own deal structure, and its own definition of "recurring revenue." The ARR number that leadership reports today is the output of a weekly reconciliation process across systems that weren't designed to talk to each other.
The business implication is direct: you can't manage a transition you can't measure in real time. Cohort analysis, churn forecasting, net revenue retention by vertical — none of these are reliable when the underlying data model is a patchwork of acquired definitions. Finance, Sales, and RevOps each maintain their own export pipeline and arrive at different numbers for the same metric. That's not a reporting problem. It's a strategic execution problem.
We've built post-acquisition analytics consolidation for diversified technology companies at this exact inflection point. Tableau is likely already in your stack — we close the upstream gap with Data Cloud, and we build the Analytics COE operating model that makes the infrastructure compound rather than just solve this quarter's reporting problem.
Post-acquisition data fragmentation across three verticals
Construction, Agriculture, and Transportation each have different data structures for the same underlying business metrics. Every acquisition compounded the fragmentation. There is no unified semantic layer — yet the board expects a single ARR number.
Tableau already deployed — the gap is upstream
Every Tableau dashboard is only as good as the data model feeding it. If Finance and Sales pull from different export pipelines, Tableau shows two versions of the truth. Data Cloud creates the unified layer that makes your existing Tableau investment actually reliable.
Subscription transition requires real-time cohort visibility
Moving from 40% to 65% recurring revenue requires cohort tracking, churn forecasting, and net revenue retention by vertical — none of which are tractable when ARR is a weekly manual reconciliation. The analytics substrate has to be live.
What this means for your team
Three infrastructure decisions that make the subscription transition trackable
Create the unified semantic layer in Data Cloud so the ARR number your board sees is live, not last week's reconciliation
Each acquisition brought its own CRM configuration, deal structure, and definition of "recurring revenue." The ARR number your board sees is the output of a week of spreadsheet reconciliation across Finance, Sales, and RevOps — and each team likely arrives at a slightly different figure.
Data Cloud creates the unified semantic layer that resolves those definitions into a single governed model. ARR, NRR, churn, and cohort metrics stop being reconciliation exercises and start being live dashboards.
Finance and Sales pull from the same source of truth. The number your board sees Monday is the same one RevOps was looking at Friday.
Close the upstream gap so your existing Tableau investment shows accurate data across all three verticals, not the best available approximation
Tableau is already in your stack. The problem isn't the visualization layer — it's what feeds it. When Construction, Agriculture, and Transportation each maintain their own export pipelines, your dashboards show the best available approximation of reality, not reality itself.
Data Cloud unification means every Tableau dashboard across every vertical pulls from a single governed model. Engineering cycles stop going to pipeline maintenance and start going to analysis.
Tableau Next's AI-assisted authoring compounds on top — analysts build faster when the underlying model is clean. Every dashboard your team builds from here benefits from that foundation.
Build an Analytics COE with shared metric definitions and vertical-specific dashboard templates so the infrastructure compounds instead of calcifying
An Analytics COE is the operating model, not just the technology. Without it, each vertical team builds their own definitions on top of the unified layer — recreating the fragmentation problem at a higher level.
The COE establishes shared metric definitions Finance, Sales, and RevOps agree on before anyone builds a dashboard. Data contracts between verticals make upstream changes visible downstream before they break another team's report. Reusable templates for subscription cohorts, churn by segment, and partner performance mean analysts build on proven work instead of starting from scratch.
This is what makes the infrastructure compound: each new quarter, each new acquisition, each new analysis starts from a higher base than the one before.
Proof of work
How we've done this before
Diversified Technology Company — Post-Acquisition Analytics Consolidation
"ARR reconciliation moved from a weekly spreadsheet exercise to a live dashboard. Finance and Sales aligned on the same renewal metric for the first time."
The challenge: A diversified technology company that had made multiple acquisitions over a five-year period was operating with fragmented CRM configurations, inconsistent ARR definitions, and a Finance team that spent the first two days of every week reconciling pipeline data before leadership could review numbers. Each business unit maintained its own Tableau export pipeline, producing slightly different versions of the same metrics.
What we built: We deployed Salesforce Data Cloud as the unified semantic layer across all acquired entities, resolving conflicting data models into a single governed definition of ARR, NRR, and churn. Tableau Next connected directly to Data Cloud, eliminating the individual export pipelines. We structured an Analytics COE with shared metric definitions, data contracts between business units, and reusable dashboard templates for subscription cohort analysis and renewal forecasting.
The outcome: ARR reconciliation moved from a two-day weekly exercise to a live dashboard updated in real time. Finance and Sales aligned on a single renewal metric for the first time across all acquired entities [VERIFY]. The COE structure meant that when the company made its next acquisition, the onboarding of that entity's data into the unified model took weeks, not quarters.
Technology Partners
Built on the platforms Trimble’s data estate demands
Teqfocus brings Salesforce Summit, Snowflake Premier, AWS Advanced, and Databricks credentials — the right tool for the right layer, without single-vendor lock-in.

- Summit Consulting Partner
- 200+ Certified Experts
- Sales Cloud, Agentforce, Data Cloud
- Agentforce deployments for Hi-Tech enterprises

- Premier Services Partner
- 20+ SnowPro Certified
- 50+ customers
- Cortex Agents architecture, dbt governance, and data fabric design

- Certified Consulting Partnert
- 20+ AI & data workloads
- MLOps pipelines
- AI governance frameworks and model monitoring

- Advanced Consulting Partner
- Data & Analytics Competency
- 150+ active engagements
- Cloud architecture for enterprise data platforms
Worth a 30-minute conversation?
If your team is working through the data infrastructure for Trimble's subscription transition, we can walk you through exactly how we'd structure the Data Cloud unification and what the COE operating model looks like in practice.